Success in the modern agricultural world is achieved not just by sowing seeds and irrigating, but by understanding the language of the soil and the plant. One of the most critical parts of this language is the fertilizer analysis process. Fertilizers, which are one of the most costly inputs used in agricultural production, must be applied at the right time, in the right amount, and in the right form, which is of vital importance for both economic and ecological sustainability. As Esular, while optimizing irrigation and fertilization processes with our smart agricultural technologies, we address in detail how the analyses, which are the cornerstone of these processes, should be performed. Smart farming systems ensure the most efficient use of resources by using data obtained from fertilizer analysis.
What is Fertilizer Analysis and Why is it Vital?
Fertilizer analysis is the process of determining the content of chemical or organic fertilizers used in agricultural areas, the current nutrient status of the soil, and the elements needed by plants in a laboratory environment using scientific methods. This analysis is the most important tool that closes the era of random fertilization and starts the era of data-driven agriculture.
For agricultural experts and farmers, fertilizer analysis is like a blood test performed before writing a prescription. It provides a wide range of information from the pH level of the soil to the amount of organic matter, from macro-nutrients (Nitrogen, Phosphorus, Potassium) to micro-nutrients (Zinc, Iron, Copper, etc.). Plant nutrition programs prepared in light of this information increase the plant's resistance to stress factors while maximizing product quality and quantity. Fertilizer analysis is also indispensable for protecting soil health and maintaining long-term agricultural productivity. Especially in the face of global problems such as climate change and decreasing water resources, the efficient use of resources is becoming even more important. Fertilization programs integrated with smart irrigation systems guarantee the optimum use of water and nutrients.
Why is Fertilizer Analysis Necessary? Basic Reasons
The reasons underlying fertilizer analysis are not limited only to yield increase. Here are the basic elements that make this analysis indispensable:
1. Developing Correct Fertilization Strategies
Every soil and every plant is different. A fertilization program that gives great results in one field can result in disappointment in a neighboring field. Fertilizer analysis clearly reveals the nutrient content of the soil and the plant, showing which element is deficient and which is in excess. In this way, the nutrients the plant needs are given in the exact amount it needs. Incorrect fertilization can negatively affect the plant's development and even lead to toxicity. Correct fertilization strategies help the plant fully reveal its genetic potential.
Benefits of Correct Fertilization Strategies:
- Optimizes plant growth and development.
- Increases plant resistance to diseases and pests.
- Improves product quality (size, color, nutritional value) and quantity.
- Reduces costs by preventing unnecessary fertilizer use.
- Prevents soil fatigue and nutrient imbalances.
2. Environmental Sustainability and Soil Health
Unconscious and excessive fertilizer use is one of the biggest factors threatening the future of agriculture. Excessively used nitrogen fertilizers mix with groundwater and cause nitrate pollution, while excessive phosphorus use can lead to the deterioration of soil structure and salinization. Thanks to analysis, the ecosystem is protected by preventing unnecessary fertilizer use. Soil health is critical for long-term productivity. Excessive chemical use can reduce the population of beneficial microorganisms in the soil and disrupt the soil structure. Fertilizer analysis contributes to the maintenance of biodiversity by preserving the vitality of the soil. Regenerative agriculture practices also serve this sustainability goal.
Environmental Benefits:
- Reduces groundwater and surface water pollution.
- Prevents soil erosion and degradation.
- Lowers greenhouse gas emissions (especially nitrous oxide).
- Supports soil microorganism activities.
- Protects and develops biodiversity.
3. Economic Efficiency and Cost Optimization
In today's world where fertilizer prices are increasing on a global scale, every gram of fertilizer is of great value. A farmer who does not have an analysis performed may waste money by reapplying an element that is already sufficient in their soil. Fertilizer analysis ensures the highest output with the lowest input by optimizing costs. This directly affects the farmer's profitability. Fertilization is one of the largest input costs of agricultural production, and every saving in this area means a significant reduction in general operating expenses.
Economic Benefits:
- Reduces fertilizer purchase costs by 15-30%.
- Increases income thanks to yield increase.
- Increases market value with quality products.
- Eliminates unnecessary labor and application costs.
- Reduces future costs by protecting soil fertility in the long term.
How is Fertilizer Analysis Performed? Step-by-Step Analysis Process
The fertilizer analysis process starts in the field and ends in the laboratory. Every stage of this process directly affects the accuracy of the result. For a correct analysis, it is essential that every step is implemented meticulously.
Stage 1: Correct Sampling (Soil and Plant)
Sampling is the heart of the analysis. If the sample does not represent the field, the laboratory results will be misleading no matter how precise they are. Things to consider in sampling are as follows:
1. Soil Sampling:
- Timing: Generally taken during the pre-planting or post-harvest period, when plant growth has stopped. Samples should be taken at least 2-3 months after fertilizer application.
- Depth: For field crops, it is taken from 0-30 cm, and for fruit trees, it is taken from two different depths: 0-30 cm and 30-60 cm.
- Method: Depending on the size and homogeneity of the field, methods such as Z pattern, diagonal pattern, or grid pattern are used. Samples are taken from at least 15-20 different points from each field and combined.
- Equipment: A clean soil auger, shovel, or sampling tube should be used. Using metal tools should be avoided.
- Preparation: The collected samples are mixed in a clean bucket, cleared of foreign substances such as stones and plant roots, and a main sample of approximately 1 kg is created. This sample is placed in a clean cloth bag and labeled (farmer name, parcel number, date, plant type).
2. Plant Tissue Sampling:
- Timing: Taken during active growth periods of the plant, when nutrient deficiency symptoms are seen, or at specific development stages.
- Which Part: Varies according to the plant species. Generally, the most recently matured leaves are preferred. For example, the ear leaf in corn, the third fully developed leaf from the top in cotton.
- Quantity: A sufficient amount (usually 50-100 leaves) of sample is taken.
- Preparation: Samples are cleared of dust, placed in paper bags, and labeled. They should be delivered to the laboratory as soon as possible. Leaf analysis shows the current nutritional status of the plant.
Stage 2: Laboratory Preparation and Extraction
Samples arriving at the laboratory are first dried, ground, and sieved. Then, special chemical solutions (extraction solutions) are used to make the nutrients measurable. A different extraction method can be preferred for each element:
- Nitrogen (N): Total nitrogen is usually determined by the Kjeldahl method or the Dumas combustion method. Different extractions are used for Nitrate and Ammonium nitrogen.
- Phosphorus (P): Olsen (for alkaline soils) or Bray (for acidic soils) methods can be preferred according to soil pH.
- Potassium (K), Calcium (Ca), Magnesium (Mg), Sodium (Na): Usually determined by ammonium acetate extraction.
- Micro-nutrients (Fe, Mn, Zn, Cu, B): Extraction solutions containing chelating agents such as DTPA (Diethylenetriamine Pentaacetic Acid) are used.
- Organic Matter: Determined by the Walkley-Black method.
Stage 3: Chemical Analysis and Measurement
Advanced devices are used in modern laboratories. These devices precisely measure the concentration of nutrients in the solutions obtained after extraction:
- pH Meter: Measures the degree of acidity or alkalinity of the soil.
- EC Meter (Electrical Conductivity): Determines the total amount of soluble salts in the soil, i.e., the salinity level. High EC can negatively affect plant growth.
- Atomic Absorption Spectrometer (AAS): Used especially to measure the concentration of metallic elements such as K, Ca, Mg, Na, Fe, Mn, Zn, Cu.
- Inductively Coupled Plasma Optical Emission Spectrometer (ICP-OES): Allows precise measurement of many elements simultaneously and even at very low concentrations.
- UV-Vis Spectrophotometer: Used in the measurement of elements such as phosphorus, nitrate, and ammonium after color reactions.
- Instrumental Carbon and Nitrogen Analyzer (CNS Analyzer): Automatically determines the total amount of carbon and nitrogen.
Basic Parameters Examined in Fertilizer Analysis
The basic values you will encounter in a fertilizer analysis report and their meanings are as follows:
1. Macro-nutrients
- Nitrogen (N): Critical for vegetative growth, protein, and chlorophyll synthesis. Its deficiency leads to yellowing in leaves and growth retardation.
- Phosphorus (P): Important for energy transfer, root development, flowering, and seed formation. Its deficiency causes purpling in leaves and weak root development.
- Potassium (K): Necessary for water balance, enzyme activation, disease resistance, and fruit quality. Its deficiency leads to drying at leaf margins and a decrease in fruit quality.
- Calcium (Ca): Cell wall structure, root tip development, and disease resistance. Its deficiency can cause fruit rot (blossom-end rot in tomatoes).
- Magnesium (Mg): Located at the center of the chlorophyll molecule, vital for photosynthesis. Its deficiency leads to yellowing between the veins in old leaves.
- Sulfur (S): Necessary for protein, vitamin, and enzyme synthesis. Its deficiency causes general yellowing in young leaves.
2. Micro-nutrients
- Iron (Fe): Plays a role in chlorophyll synthesis, respiration, and photosynthesis. Its deficiency leads to yellowing between the veins in young leaves.
- Manganese (Mn): Involved in photosynthesis, respiration, and nitrogen metabolism. Its deficiency causes yellowing between the veins and brown spots in young leaves.
- Zinc (Zn): Critical for enzyme activation and synthesis of growth hormones. Its deficiency causes small leaves and shortening in internodes.
- Copper (Cu): Plays a role in photosynthesis and respiration, found in the structure of enzymes. Its deficiency causes wilting and tip drying in young leaves.
- Boron (B): Important for cell wall formation, flowering, fruit set, and pollen germination. Its deficiency leads to death at growth points and deformation in fruits.
- Molybdenum (Mo): Necessary for nitrogen metabolism and activation of the nitrate reductase enzyme. Its deficiency is similar to nitrogen deficiency symptoms.
- Chlorine (Cl): Plays a role in photosynthesis and osmotic pressure regulation.
3. Soil Properties
- pH: The degree of acidity or alkalinity of the soil (between 0-14). It directly affects the availability of nutrients to the plant. The ideal pH range for most plants is 6.0-7.0.
- EC (Electrical Conductivity): Shows the total amount of soluble salts in the soil (in dS/m). High EC indicates soil salinity and difficulty in water uptake in plants.
- Organic Matter (OM): Critical for soil fertility, water holding capacity, nutrient holding capacity, and soil structure. Between 2-5% is considered ideal.
- Lime (CaCO3): A factor that increases soil pH. High lime can reduce the availability of some micro-nutrients (especially iron and zinc).
- Soil Type (Texture): Determined according to the proportions of sand, clay, and silt. Affects water holding, aeration, and nutrient holding capacity.
Fertilizer Requirement Calculation Formulas
After the analysis results arrive, certain formulas are used to calculate the amount of fertilizer to be applied. Here is a basic calculation logic:
Example Scenario: As a result of the analysis, it was determined that you need to apply 10 kg of pure nitrogen (N) per decare to your field. You have Urea fertilizer containing 46% nitrogen.
Calculation: (10 kg N / 46) x 100 = 21.74 kg of Urea fertilizer should be applied.
Phosphorus (P) Calculation Example:
- Plant requirement: 5 kg pure P2O5/da
- Fertilizer to be used: DAP (18% N, 46% P2O5)
- Calculation:
(5 kg P2O5 / 46) x 100 = 10.87 kg of DAP fertilizer should be applied.
Potassium (K) Calculation Example:
- Plant requirement: 8 kg pure K2O/da
- Fertilizer to be used: Potassium Sulfate (50% K2O)
- Calculation:
(8 kg K2O / 50) x 100 = 16 kg of Potassium Sulfate fertilizer should be applied.
These calculations should be adjusted according to factors such as existing nutrient levels in the soil, plant type, and expected yield. Every fertilization program should be approved by an agricultural consultant or agricultural engineer.
Different Types of Fertilizer Analysis
Although soil analysis is the first thing that comes to mind when fertilizer analysis is mentioned, different types of analysis also exist to further optimize plant nutrition programs.
1. Soil Analysis
It is the most basic and common type of analysis. By determining the physical and chemical properties of the soil, it shows the nutrient status in the root zone of the plant and the fertilizer holding capacity of the soil. It forms the basis for long-term fertilization planning.
2. Plant Tissue Analysis (Leaf Analysis)
Reflects the current nutritional status of the plant. It shows how much of the nutrients taken from the soil are absorbed by the plant and their distribution within the plant body. It is very valuable for detecting hidden nutrient deficiencies that appear especially during the growth period and for intervening quickly. Leaf analysis is a critical tool for understanding the real-time needs of the plant.
3. Water Analysis
Irrigation water quality is as important for plant health and soil fertility as fertilization. Water analysis determines the pH, EC value (salinity), and concentration of elements such as sodium, chlorine, and bicarbonate in the irrigation water. Waters containing high salinity or harmful elements can accumulate in the soil and negatively affect plant development. This analysis is indispensable in the preparation of nutrient solutions used especially in drip irrigation and hydroponic systems. Irrigation water analysis is a fundamental step for the correct management of water resources.
Accuracy Rate and Quality Control in Fertilizer Analysis
The accuracy rate of fertilizer analysis can reach levels of 90-95% depending on the meticulousness in the analysis process. However, the following factors should be considered:
- Sampling Errors: The most common accuracy problem. A sample that does not correctly represent the field will lead to incorrect results.
- Laboratory Errors: Equipment calibration, accuracy of chemical reagents, and personnel competence can affect results.
- Interpretation Errors: Interpreting the obtained results without considering the plant type, climate conditions, and soil structure can be misleading.
Quality Control Measures:
- Accredited Laboratories: Reliable laboratories providing services at international standards should be preferred.
- Reference Samples: Laboratories should regularly verify their own analyses with standard reference samples.
- Repeated Analyses: Especially in critical situations or on large lands, repeated analyses can be performed with samples taken from the same region at different times.
- Integration with Field Observation: Laboratory results should be verified by comparing them with plant observations and performance in the field.
Interpreting and Applying Fertilizer Analysis Results
A fertilizer analysis report does not consist of a series of numerical values; when interpreted correctly, it becomes a map guiding the farmer. To understand and take action on this report, some basic steps should be followed:
1. Critical Values and Optimum Ranges
For each nutrient, there are critical values and optimum ranges determined according to the plant type and soil structure. These values are usually specified as reference ranges in reports. If the value of an element is below the critical level, it means deficiency; if it is above the optimum range, it may mean excess or toxicity risk.
- Deficiency: The growth and yield of the plant can be seriously affected. Requires quick intervention.
- Optimum: Sufficient level for healthy growth and maximum yield of the plant.
- Excess/Toxicity: May show poisoning symptoms in the plant, prevent the uptake of other nutrients, or lead to environmental pollution.
2. Report Reading Tips
Analysis reports usually include complex tables and graphs. Here are tips to better understand the report:
- Primary Nutrients: Prioritize Nitrogen, Phosphorus, and Potassium values. These are the elements the plant needs most.
- pH and EC: These two values are very important because they affect the availability of all other nutrients. High or low pH can cause some elements to be locked up.
- Organic Matter: An important indicator of soil health and fertility. Low organic matter indicates a low nutrient holding capacity.
- Evaluation According to Plant Type: Every plant's nutrient requirement is different. Evaluate the report according to the specific requirements of the plant you are growing.
- Following Trends: Tracking changes in soil nutrient levels with annual or seasonal analyses is important for developing long-term strategies.
Common Mistakes and What to Avoid
To get the best efficiency from fertilizer analysis, some common mistakes should be avoided:
- Incorrect Sampling: Samples that do not correctly represent the field cause the entire analysis to be wasted. Separate samples should be taken from areas with different soil types.
- One-Time Analysis: Soil structure and nutrient levels change over time. Having regular analyses (every 1-3 years) performed is critical for a dynamic fertilization program.
- Fertilizing Without Interpreting the Report: Applying fertilizer without understanding the laboratory report or getting an expert opinion can lead to both financial losses and environmental damage.
- Neglecting Plant Observation: Laboratory results are important but should be combined with the actual status of the plant in the field. Development problems or deficiency symptoms in the plant should support the analysis.
- Incorrect Fertilizer Selection and Application Time: While soil analysis shows which fertilizer to give and how much, selecting the appropriate fertilizer for the plant's growth stage and applying it at the right time is also of great importance. Smart fertilization systems can optimize this process.
Fertilizer Analysis Cost and Return on Investment (ROI)
Although fertilizer analysis seems like a cost initially, it is an investment that more than pays for itself with the long-term benefits it provides. The cost may vary according to the laboratory, the number of parameters to be analyzed, and the sample type. However, the return on investment (ROI) obtained is much higher.
Cost Factors:
- Analysis Type: Only basic macro elements, or are micro elements and soil properties also included?
- Laboratory: Accredited and established laboratories may have higher prices but offer more reliable results.
- Number of Samples: As the number of samples to be taken increases, the total cost also increases.
- Additional Services: Services such as agricultural engineer consultancy or creating a special fertilization program can bring additional costs.
Return on Investment (ROI):
Fertilizer analysis generally provides fertilizer savings of between 15-30%. In addition, thanks to correct nutrition, an increase of 10-25%, and in some cases even more, can be seen in product yield. The increase in product quality also raises the market value. These savings and increased income cover the analysis cost in a short time and significantly increase the farmer's net profit. Organizations such as the Food and Agriculture Organization of the United Nations (FAO) emphasize the importance of soil analysis for the efficient use of resources and sustainable agriculture. FAO's soil analysis guides provide important information on this subject.
Smart Farming and Esular: Combining Analysis with Technology
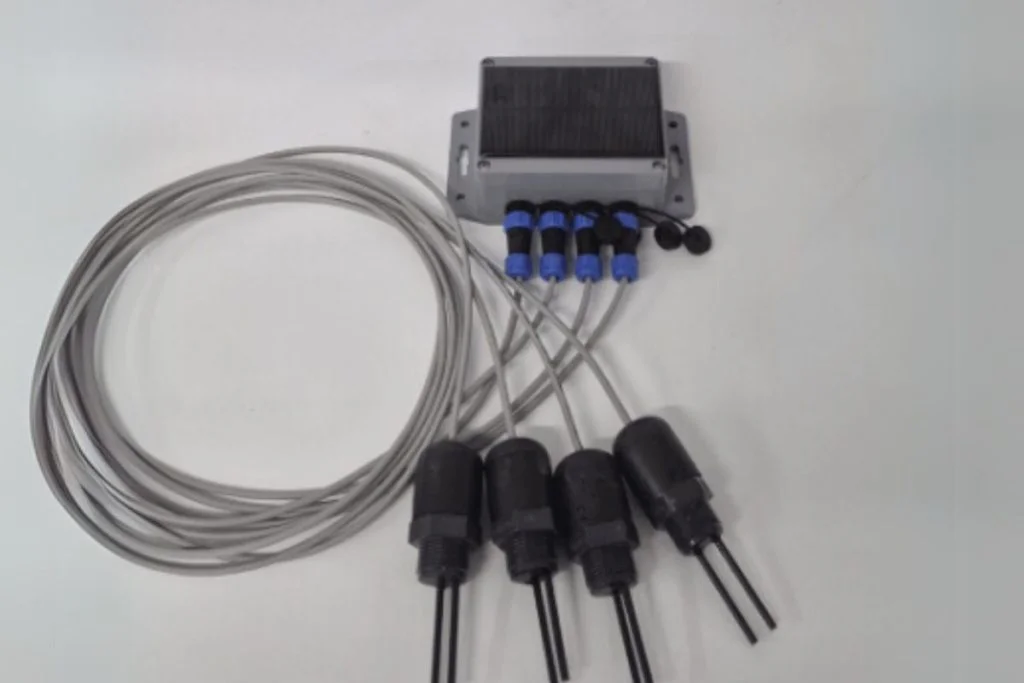
Fertilizer analysis tells us "how much" fertilizer we should give. However, Esular technologies answer the question of "how" and "when" this fertilizer will be given. Thanks to our smart irrigation systems and soil moisture sensors, data obtained from fertilizer analysis is integrated into our digital systems.
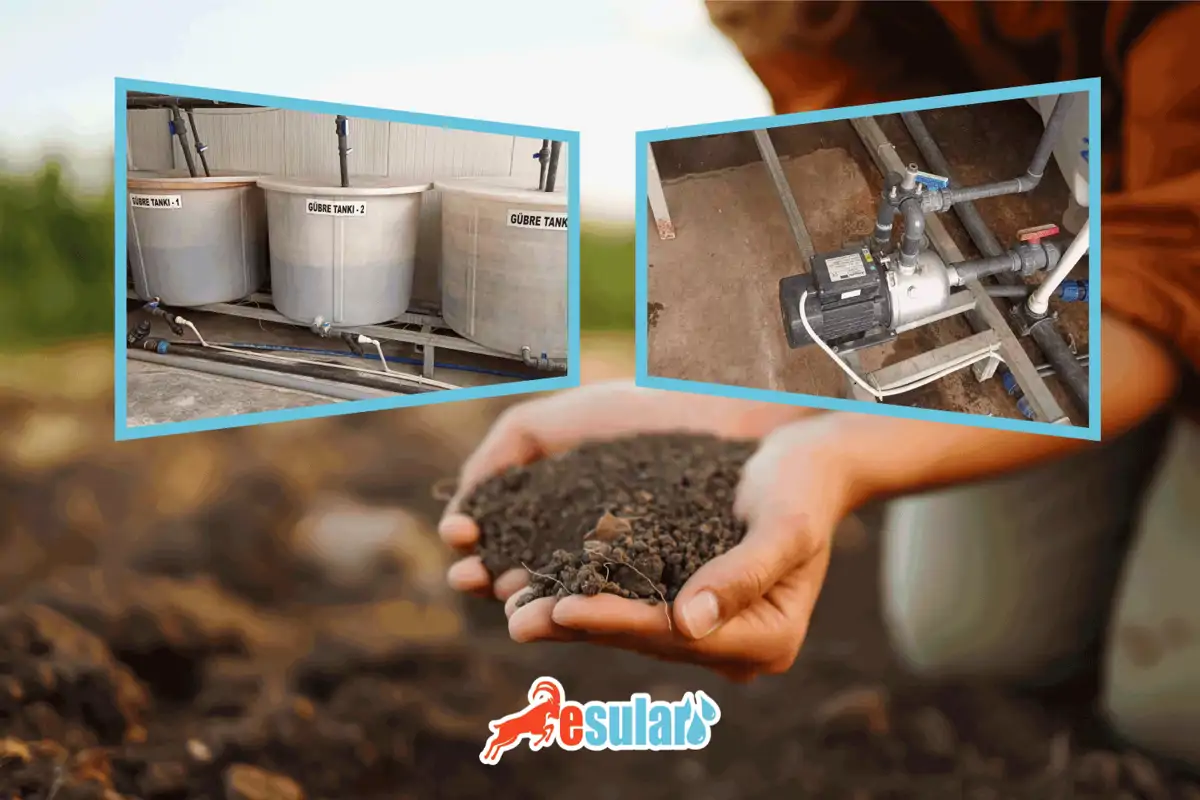
For example, our fertilization (fertigation) systems deliver the nutrient solution prepared according to the deficiencies in the analysis report to the root zone of the plant at the most ideal moisture level. In this way, the fertilizer is prevented from washing away and its absorption by the plant is maximized. With our IoT-based solutions and meteorology stations, we provide full automation by combining analysis results with instantaneous data in the field.
Advantages of Fertilization Optimization with Esular:
- Precise Dosing: Fertilizer is given as much as the plant needs, excessive use is prevented.
- Timing Optimization: Fertilization is performed during periods when the plant needs it most.
- Water Saving: By working integrated with smart irrigation, it ensures that the fertilizer reaches the plant most efficiently along with water.
- Labor and Energy Saving: Human power and energy costs decrease thanks to automatic systems.
- Environmental Protection: Fertilizer leaching and groundwater pollution are minimized.
- Yield and Quality Increase: Product yield and quality are maximized with optimum nutrition.
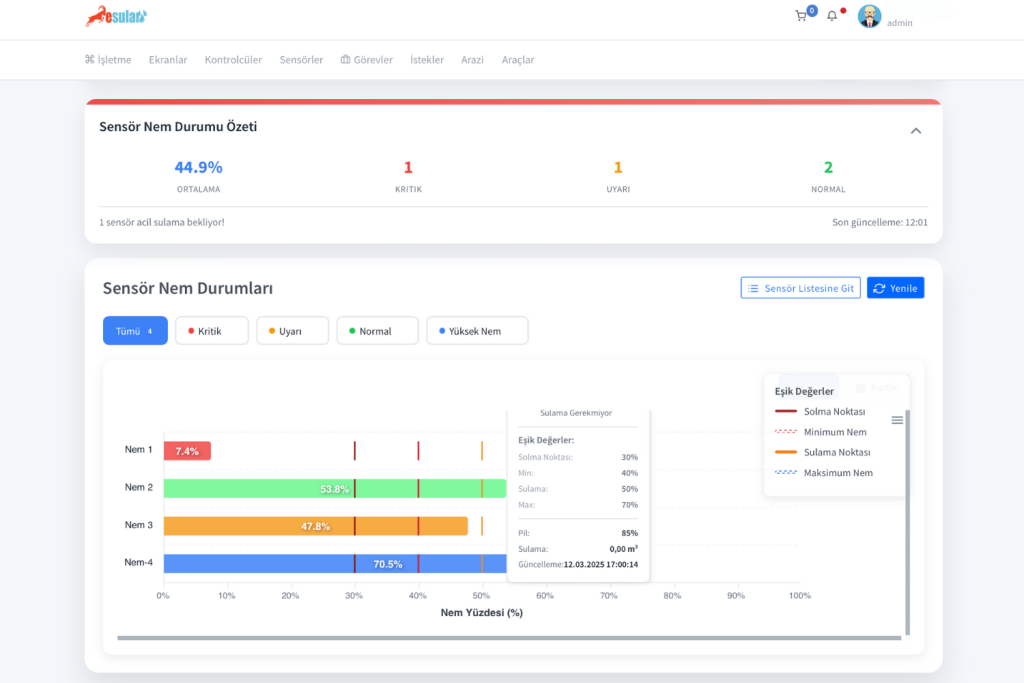
- Real-Time Monitoring: The effect of fertilization is followed instantaneously by continuously monitoring parameters such as soil moisture, EC, and pH.
Esular's smart fertilization systems offer farmers the opportunity to make data-driven decisions and digitalize their agricultural processes. In this way, the agricultural needs of both today and the future are met.
The Future of Fertilizer Analysis: Digitalization and Artificial Intelligence
Digitalization and artificial intelligence (AI) technologies in agriculture are also transforming fertilizer analysis processes. In addition to traditional laboratory analyses, sensors that collect instantaneous data in the field and AI algorithms that process this data make fertilization decisions faster and more accurate.
Contributions of Digitalization:
- Instant Data Collection: Nutrient status in the field, plant health, and growth dynamics can be monitored instantaneously with technologies such as drones, satellite images, and meteorology stations.
- Artificial Intelligence Supported Predictions: AI algorithms can predict future nutrient needs using past analysis data, weather forecasts, and plant development models.
- Precise Application: Thanks to digital mapping and variable rate fertilization (VRT) equipment, only as much fertilizer as needed can be applied to each part of the field. This minimizes fertilizer waste.
- Integrated Management: Fertilizer analysis data is integrated with other agricultural activities such as irrigation, spraying, and disease management to create a holistic management model.
Esular, with solutions such as the Digital Fertilization Assistant, offers special fertilization recommendations to farmers by combining artificial intelligence with soil analyses. This helps farmers make more conscious and efficient decisions while shaping the future of agriculture.
Conclusion: Build the Future with Data-Driven Agriculture
Fertilizer analysis is not an expense, but the most profitable investment made in the future of your agricultural business. When correct analysis, correct application, and the smart technologies offered by Esular come together, you protect both your soil and multiply your earnings. Remember, you cannot manage what you cannot measure.
Determine the needs of your field with scientific methods and meet Esular's smart irrigation and automation solutions to implement this data in the most efficient way. Technology is always by your side for sustainable and high-yield agriculture!
Do not hesitate to contact us for more information or to consult about our special solutions. Our expert team is ready to help you maximize the potential of your field.