Introduction: Why Should Pivot Irrigation be Reported in Modern Agriculture?
Center pivot irrigation systems form the backbone of irrigation operations worldwide and especially in the vast agricultural lands of Turkey. These giant machines, which ensure homogeneous irrigation of thousands of decares of land, can lead to serious water and energy waste when not managed correctly. Many business owners do not know exactly how many cubic meters of water their pivot actually consumed that day, how long it stayed in which part of the field, or how energy interruptions disrupted the irrigation cycle. At this point, the ESular Pivot Irrigation Report System comes into play, transforming traditional irrigation methods into digital data centers.
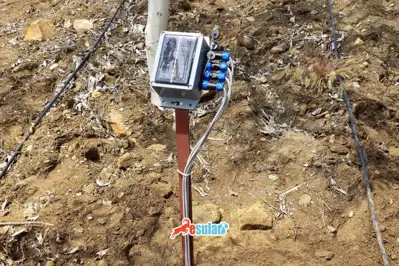
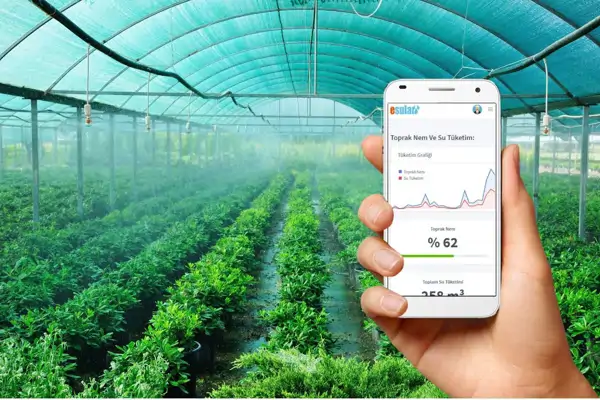
This system, which processes data from IoT (Internet of Things) based sensor networks in real-time, allows farmers and agricultural engineers to find answers to these critical questions: How many m³ of water did my pivot provide today? Is every point of my field irrigated equally? Does it work more efficiently at night or during the day? How much do energy interruptions affect irrigation? And most importantly; does water continue to flow while the pivot is stopped? The answer to these questions is indispensable not only for operational convenience but also for sustainable agriculture. For more detailed information, you can check our what are smart irrigation systems guide.
Report Architecture: 11 Different Analysis Dimensions
The reporting interface developed by ESular is designed as a single page application (SPA) with sidebar navigation to keep the user experience at the highest level. This architecture allows the user to reach massive data sets within seconds without getting lost between pages. Each tab of the report focuses on a different technical dimension of the irrigation operation.
Analysis Tabs Included in the System:
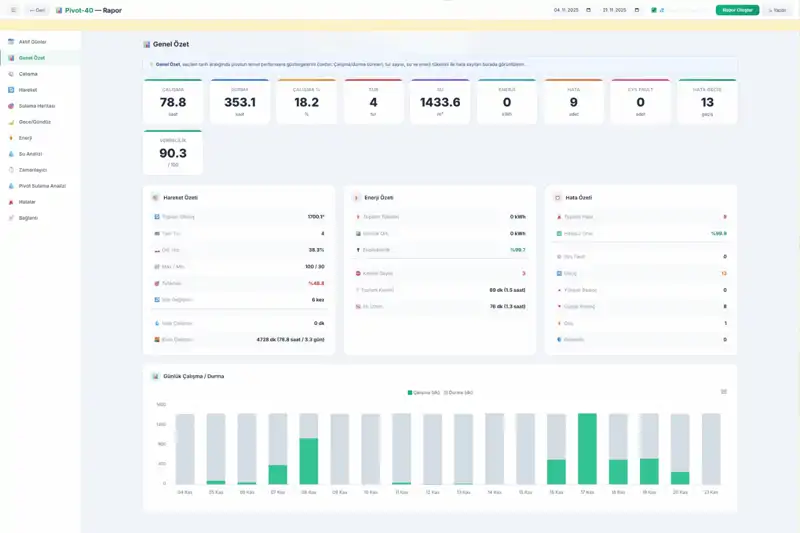
General Summary: Real-time Performance Tracking with 9 Critical KPI Cards
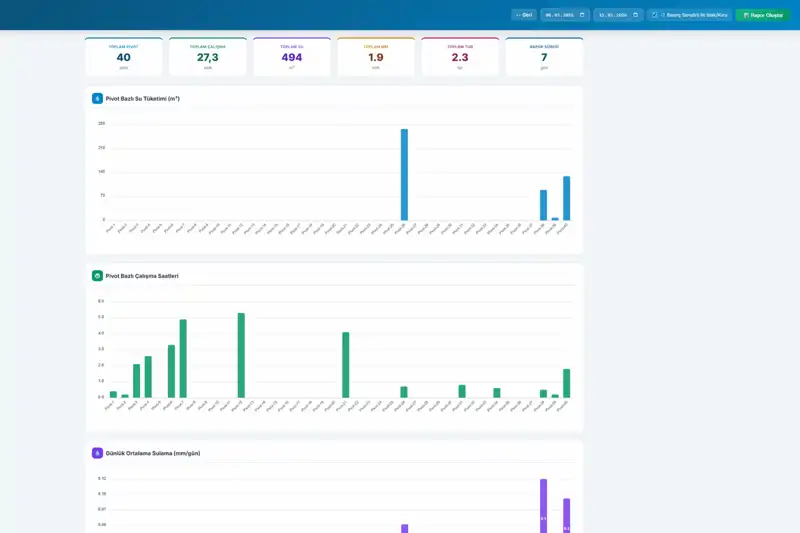
The main page of the report summarizes all operational data in the selected date range with 9 basic KPI (Key Performance Indicator) cards. These cards help the business manager understand the health of the irrigation process within seconds. For data accuracy, data from IoT devices such as pressure sensors are cross-checked.
Basic Metrics Provided by the Report:
- Operating Time: Total hours the pivot is actively moving or providing water.
- Stopping Time: Total time the system is passive.
- Operating Percentage (%): The ratio of active time to total reporting time.
- Number of Turns: The number of full 360-degree turns completed by the pivot.
- Water Consumption (m³): Total amount of water estimated or measured from the flow meter.
- Energy Consumption (kWh): Total electricity consumption.
- Number of Errors and System Failures: The frequency of technical problems that occurred.
- Efficiency Score: Evaluation of general system performance out of 100.
Pivot Movement Simulation: Digital Twin Technology
One of the most innovative features of the ESular Pivot Report System is the simulation engine that animates the pivot's past movements like a video player. Developed using Canvas-based 2D rendering technology (700x500px), this engine presents the angular changes, speed, and direction of the pivot arm as an animation using real sensor data.
Technical Features of the Simulation
The system processes readout (data reading) packets received every 5 minutes to create a smooth animation. Users can rewind or fast-forward the reported time thanks to the timeline scrubber. Playback speeds can be adjusted from 1X to 100X, so a 24-hour irrigation operation can be observed in a few minutes.
Visual Elements on the Simulation Screen:
- Pivot Arm: Dynamic arm animation positioned according to its real angle in the field.
- Top Left Overlay: Instant angle value and system status (Running/Stopped).
- Top Right Overlay: Motor speed (%) and movement direction (Forward/Reverse).
- Direction Analysis: The duration the pivot worked forward and backward is visualized with a donut chart.
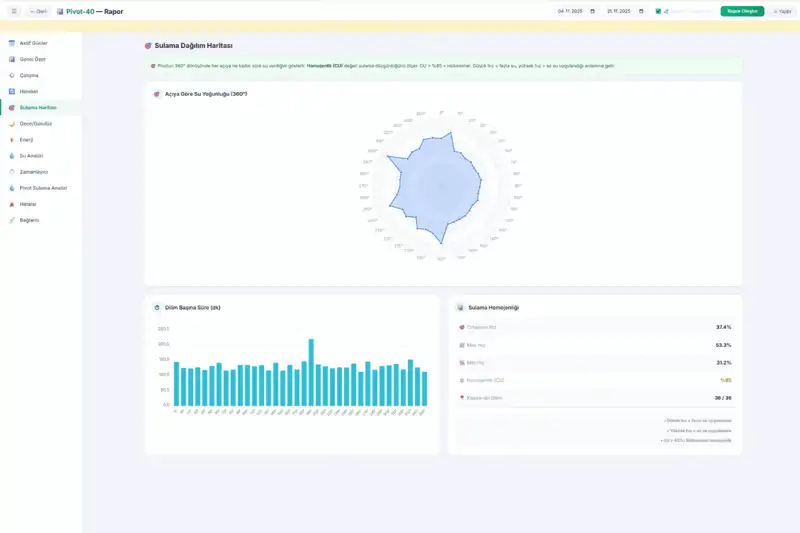
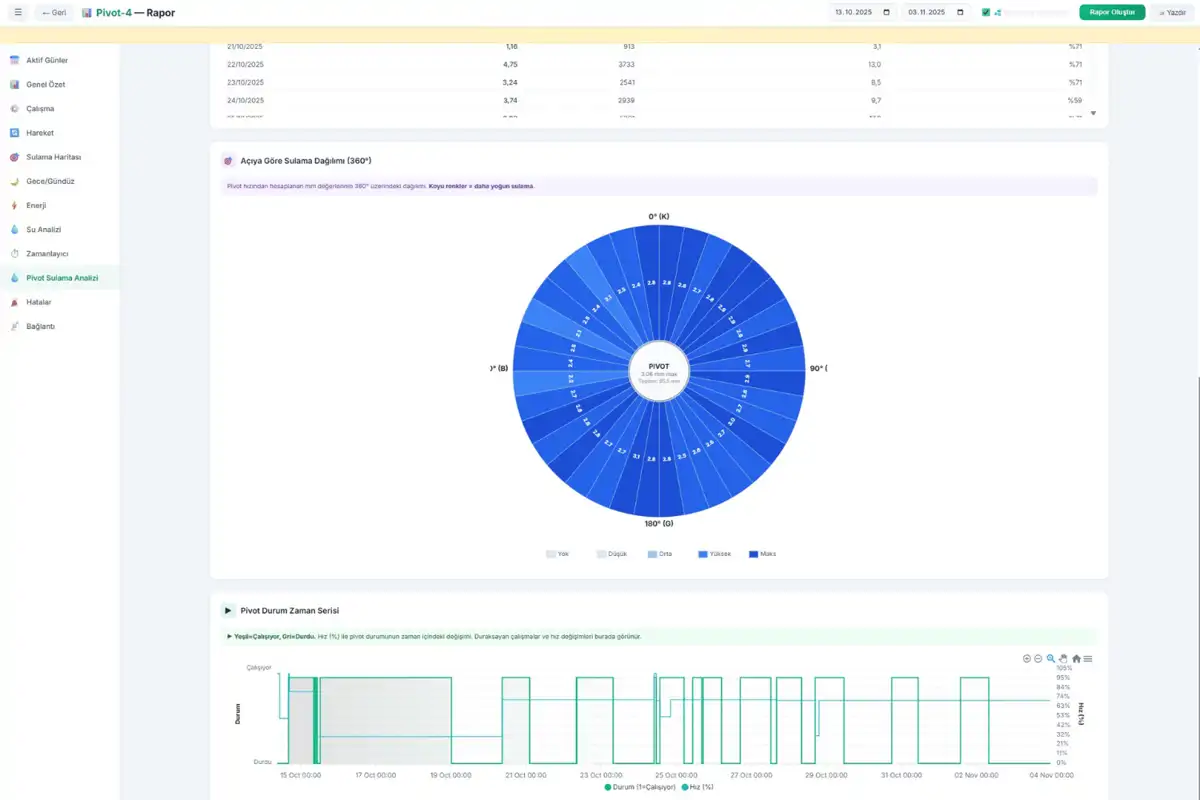
Irrigation Map and Christiansen Uniformity Coefficient (CU)
The biggest risk in pivot irrigation systems is that some parts of the field are over-irrigated while some parts remain dry. ESular's 360° circular irrigation map shows how long water was provided to each one-degree segment in a polar coordinate system. This map places irrigation uniformity on a scientific basis.
Uniformity Coefficient (CU) Evaluation:
- CU > 85%: Excellent and homogeneous irrigation. Plant development is equal everywhere in the field.
- CU 75-85%: Good level of irrigation. Within acceptable limits.
- CU < 75%: Low efficiency. Immediate intervention, speed adjustment control, or sprinkler package maintenance is required.
Dark colors on the map represent more intense irrigation (low speed), while light colors represent less water application (high speed). Distinct color differences are direct evidence of a malfunction in the system or operator error. For more technical details on this subject, you can examine our ESular Vision system.
Comparison of Night and Day Irrigation Efficiency
In agricultural economics, irrigation timing is directly related to cost and yield. The ESular report system automatically separates and compares the pivot's night (21:00-06:00) and day (06:00-21:00) working hours.
Advantages of Night Irrigation:
- Evaporation Loss: During the day, 20-40% of the water can evaporate before reaching the plant due to the sun and high temperatures. This rate is minimized at night.
- Wind Effect: Wind is usually calmer during night hours, which ensures that water droplets fall more evenly on the target point.
- Energy Cost: In many regions, agricultural irrigation tariffs are 30-50% cheaper during night hours.
- Plant Health: Wet leaves under the sun during the day can create a lens effect, inviting burns or fungal diseases.
The report presents this data with a donut chart and 24-hour bar charts, allowing the farmer to shift the irrigation schedule to more economical hours. You can get information about the effect of climate data on irrigation from our article on agricultural meteorology stations.
Water Consumption Analysis: Pressure and Flow Data
The water analysis tab, one of the most comprehensive parts of the system, measures not only how much the pivot has turned but also how much water it has left in the field. Data can be fed from two sources: Direct water meter reading or a combination of pressure sensor data and operating time.
Basic Graphics in the Analysis Tab:
- Pressure Time Series: Change of system pressure (bar) over time. Sudden drops indicate pump failure or pipe burst, while sudden rises indicate line blockage.
- Instant Irrigation Rate (mm/h): The rate of water falling on the field at any moment. This value being constant proves that a homogeneous irrigation is performed.
- Cumulative Application Depth (mm): Total water depth accumulated during the report period.
- Circular Heatmap: By blending pivot speed and pressure data, how many mm of water fell on which point of the 360-degree land is visualized.
Pivot Timer: Speed, Duration, and Water Calculation Table
Vital for operational planning, the timer tab pre-calculates how the pivot will perform at different speed levels. Two basic constants are defined in the system for each pivot:
- BaseHours: The time (hours) it takes for the pivot to complete one full 360-degree turn at 100% speed.
- MmAt100: The total amount of water (mm) applied in one turn at 100% speed.
Calculation Examples:
The system produces the most accurate result by taking real readout data, database settings, or arm length (e.g., 550m) as a reference when determining the 100% turn time.
Anomaly Detection: Smart Algorithms Stopping Water Waste
The most critical security feature of the report system is the detection of water flow while the pivot is stopped. This situation is usually caused by pump control errors, valve leaks, or sensor failures and causes tons of water to flow to waste.
How Does the System Work?
ESular algorithms compare the pivot's movement status and line pressure in every data packet. If the pivot is in the "Stopped" position but line pressure or flow data continues to come, the system immediately generates an anomaly alarm. The following information is given with a red card on the report screen:
- Total Waste Time: How long the anomaly status lasted.
- Estimated Waste (m³): The amount of water flowing to waste.
- Event Location: The exact angular position on the polar map where the leak or waste occurred.
This feature acts as a shield protecting operational costs, especially during night hours or when the operator is not in the field. For similar control mechanisms, you can examine our pressure monitoring and valve control systems.
Error Analysis and System Reliability
Pivot systems consist of complex mechanical and electronic components. The ESular Pivot Report System categorizes all errors that occur and detects in which region of the field these errors are concentrated.
Error Types and Analysis Methods:
- Sys Fault (System Failures): Electronic board or motor driver failures.
- Error Transitions: How often the system transitions from normal to faulty state (indicator of unstable operation).
- Error Locations Polar Map: If errors are concentrated at certain angles, it can be understood that there is ground degradation, a slope problem, or a physical obstacle in that area.
- Error Animation: Animating errors in time sequence makes it easier to find the source of the problem.
This data enables maintenance teams to make point-blank interventions, minimizing downtime.
Connection Analysis: IoT Uptime and Data Quality
The reliability of a report depends on the continuous flow of data. The connection analysis tab monitors the communication quality between the pivot panel and the cloud server. The IoT Uptime rate shows how long the system remained online.
Importance of Connection Tracking:
- Errors occurring during offline periods cannot be transmitted as instant notifications.
- Long connection interruptions indicate antenna or SIM card problems.
- The system lists the periods spent offline in a table and records the status of the pivot (running/stopped) at that time.
Wet and Dry Segment Detection
Many pivot systems are moved without giving water just to fertilize or to reach a certain point (Dry running). The ESular report system separates the operating time into "Wet" and "Dry" using pressure sensor data.
Practical Effects:
- The actual time water is provided is clearly measured.
- Cubic meter (m³) calculations are not exaggerated because they do not include dry running times.
- The overall efficiency score (KPI) is calculated much more accurately.
Technical Infrastructure and Technology Stack
The ESular Pivot Irrigation Report System is built on modern software technologies and industrial IoT standards. To present high data density smoothly, the following technologies were used:
- Frontend: Vanilla JS and custom CSS Grid/Flexbox architecture.
- Graphics Engine: ApexCharts for interactive and responsive graphics.
- Simulation: HTML5 Canvas 2D for high-performance visualization.
- Backend: ASP.NET Core REST API for scalable and secure data processing.
- IoT Integration: ESular smart control units for angle, speed, pressure, and voltage data.
The system also offers PDF and paper print support for professional report output. Thanks to the CSS structure optimized for landscape page layout, reports can be printed in a format suitable for corporate presentations.
Pivot Report System by the Numbers
Conclusion: Data-Driven Pivot Management
The ESular Pivot Irrigation Report System is not just a data monitoring tool, but also a decision support system that reduces operational costs and increases yield. Dominating every one-degree segment of your field, detecting water waste instantly, and optimizing energy costs are requirements of modern agriculture. With these comprehensive solutions offered by ESular, you can transform your center pivot systems into digital efficiency machines.
To get to know our precision farming technologies more closely and to determine the most suitable sensor packages for your pivot system, contact us. In addition, you can examine our wireless battery-powered pivot end GPS position sensor product to track the position of your pivot system instantly.
Contact the ESular expert team now for more information and demo requests and start the digital transformation in agriculture!
Sıkça Sorulan Sorular
Is the ESular Pivot Irrigation Report System compatible with every brand of pivot device?
Yes, ESular IoT control units have a universal design and can be easily integrated into all existing center pivot brands. In this way, you can report all your pivot systems through a single digital platform regardless of the brand, analyze past data, and manage your irrigation processes centrally.
How are water waste and leaks automatically detected in the pivot irrigation system?
The system uses smart algorithms that compare the pivot's movement status and line pressure in real-time. If water flow or pressure continues in the system while the pivot is stopped, ESular perceives this as an anomaly, calculates the amount of water flowing to waste, and prevents large-scale water waste by sending an immediate warning to the user via mobile notification or SMS.
What benefits does the Christiansen Uniformity Coefficient (CU) report provide to the farmer?
This report measures how evenly water is distributed to every point of the field based on a scientific basis. While a CU value above 85% represents excellent uniformity, low values help you detect problems such as speed adjustment failure or sprinkler failure that negatively affect plant development early and help you increase irrigation quality.
Why is the night and day irrigation efficiency analysis of strategic importance?
In irrigations performed at night, evaporation loss is minimized and since the wind effect decreases, water distribution occurs much more homogeneously. The ESular report system provides you with concrete data to both reduce your energy costs and maximize the rate of water reaching the plant root by automatically comparing night and day data.
How does the pivot movement simulation feature visualize past operations?
The simulation engine using digital twin technology animates the pivot's past movements like a video using real angle and speed data from sensors. Users can examine in detail how long they stayed in which part of the field and in which angles the irrigation was concentrated by rewinding or fast-forwarding the operation over the timeline.
How are system failures and error locations shown on the report screen?
The system categorizes all technical malfunctions that occur and visualizes at exactly what angle of the field these errors occurred on a polar map. Thanks to this feature, maintenance teams can understand whether the problem stems from a ground degradation or a mechanical obstacle in a certain region and can make point-blank interventions and shorten downtime.
What does wet and dry operation detection change in irrigation reports?
Thanks to the data from the pressure sensors, the system clearly separates the time the pivot only moved (dry) from the time it worked by giving water (wet). This separation allows the real water consumption amount and cumulative application depth (mm) to be calculated without error, enabling the efficiency score to be created realistically.