What is NDVI (Normalized Difference Vegetation Index)?
NDVI (normalized difference vegetation index), normalized difference vegetation index; It is an index that analyzes and reveals the density and health status of the vegetation in an observed area.
There are different aspects to controlling the increase and decrease of plants, which have an important place for the ecosystem. One of the most preferred clues is remote sensing methods. Changes in vegetation can be observed using satellite images without going to the field. Satellites collect information about the earth through receivers according to the response given by the electromagnetic waves they send to the earth. This obtained information is processed in different bands in satellite images, and thanks to remote sensing technology, the vegetation map of any region can be easily created. In addition, the vegetation density of even areas that are difficult and costly to detect with human power can be easily determined.
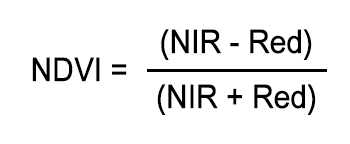
Calculation of the NDVI Formula
To state the Calculation of the NDVI Formula simply, as shown below, the Normalized Difference Vegetation Index (NDVI) uses near-infrared (NIR) and red (RED) bands in its formula.
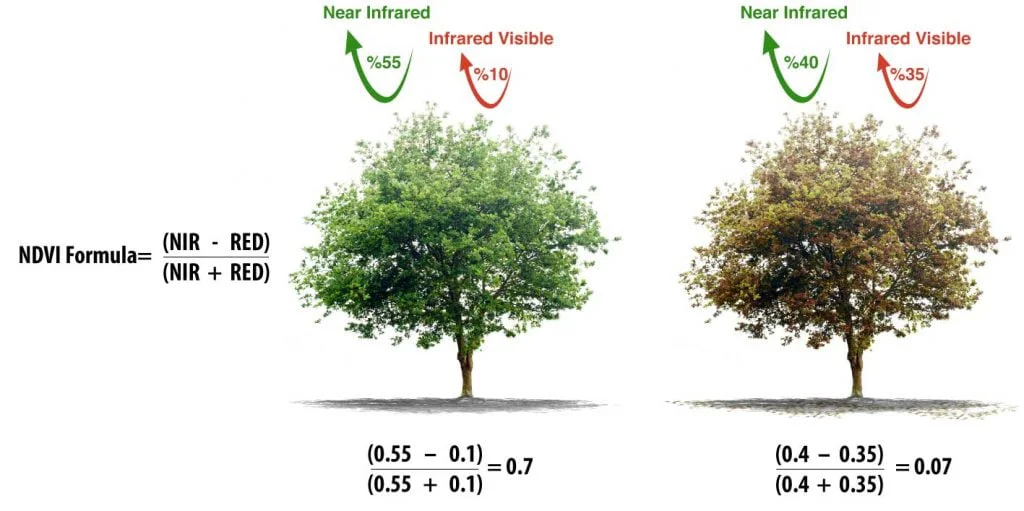
Healthy vegetation (chlorophyll) reflects more near-infrared (NIR) and green light compared to other wavelengths, absorbs blue and red light, and because it reflects green light, it appears green to the human eye.
A normal healthy plant absorbs visible light and reflects a large part of the near-infrared light. On the other hand, an unhealthy plant reflects more visible light and reflects less near-infrared light.
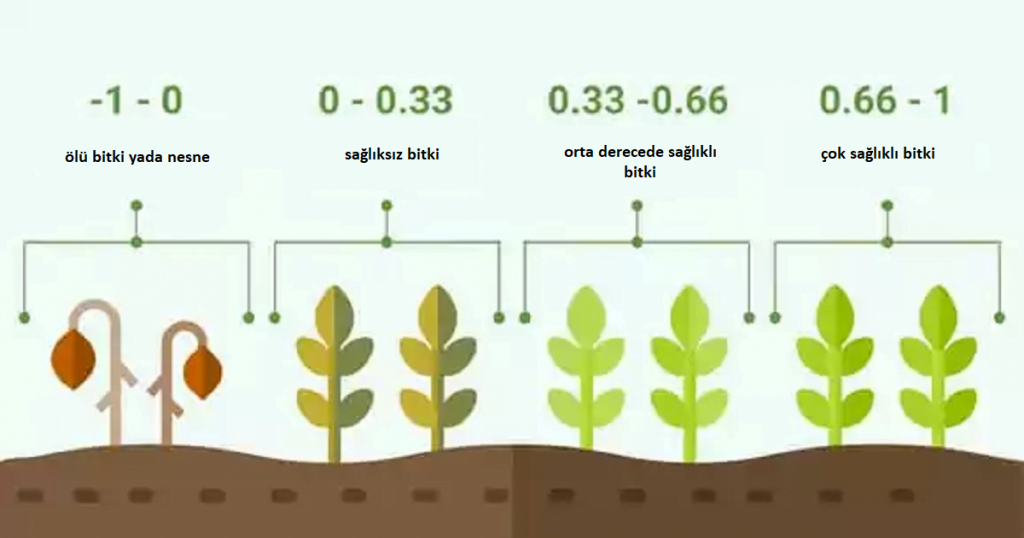
NDVI Values
NDVI values are the values obtained as a result of the analysis. NDVI values always range between -1 and +1. In places where healthy and dense vegetation is high, index values approach +1, while in places where unhealthy and weak vegetation is high, the index value approaches -1.
NDVI Map
The NDVI Map is created by classifying the values obtained as a result of the NDVI analysis in a way that is suitable for the study to be carried out.
For example; Negative values mostly consist of clouds, water, and snow, while values close to zero primarily consist of rocks and bare soil.
Very small values of the NDVI function (0.1 or less) correspond to areas of bare rock, sand, or snow.
Medium values (from 0.2 to 0.3) represent shrubs and grasslands, while large values (from 0.6 to 0.8) indicate temperate and tropical forests.
What is NDVI Information Used For?
We can list the usage areas of NDVI information as follows.
Chlorophyll level is determined
Plant health and stress level
Optimum fertilizer use
Nitrogen Management
Identify insects and pests in the crop
Analyze plant diseases
Plant or weed identification
Farm plan development
Cultivation planning
Harvest planning according to vigor
Use of NDVI Analysis in Agriculture
The use of NDVI analysis in agriculture has become the most frequently preferred remote sensing analysis vegetation index in agriculture thanks to developing drone technology. It helps to distinguish lands devoid of vegetation from grass or forest areas, detect diseased plants, and distinguish between the development stages of crops.
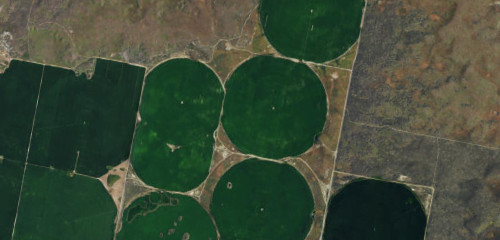
NDVI Example in Agriculture
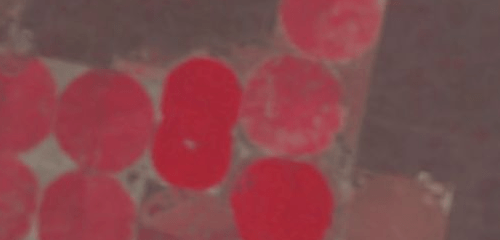
NDVI example in agriculture; Let's examine NDVI for an agricultural area with center pivot irrigation. Pivot irrigation rotates on a point creating a circular crop pattern. In true color, red, green, and blue bands look as follows. True color we call it because it is the same as what our eye sees.
In the formula, you can see how NDVI benefits from near-infrared (NIR). When we show the NIR band as red, we get color infrared. We call it color infrared because near-infrared is in the red channel. As seen below, pivot irrigation vegetation should be bright red.
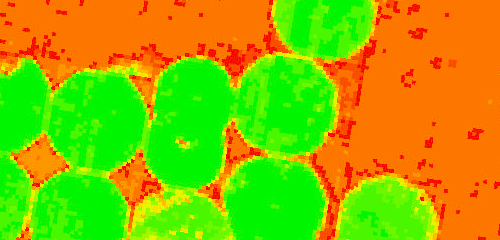
When you apply the formula, bright green indicates high NDVI. Red has low NDVI. Therefore, it measures vegetation by measuring the difference between near-infrared (which vegetation reflects strongly) and red light (which vegetation absorbs).